How Depreciation Figures Are Measured
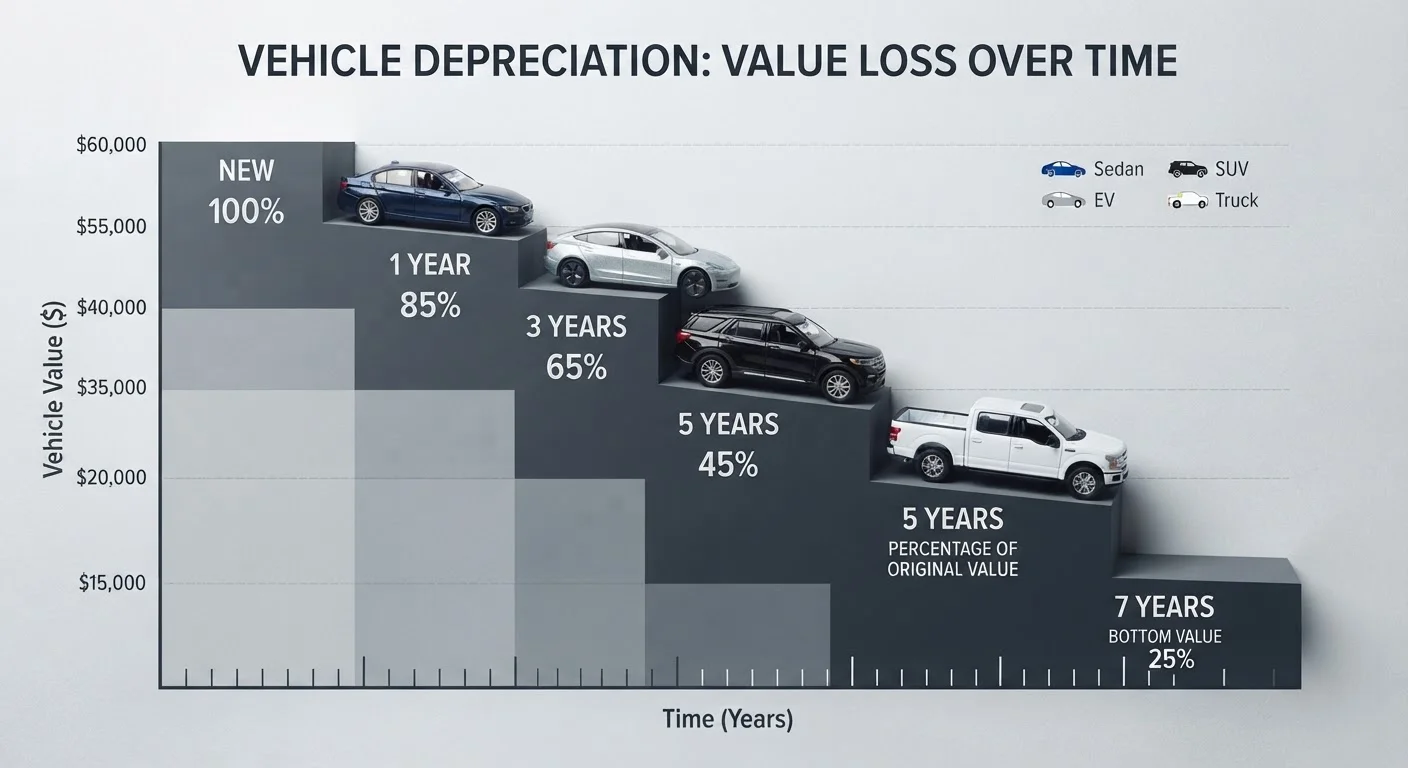
Vehicle depreciation is typically expressed as the percentage of original MSRP lost over a defined period. Industry benchmarks are built from large transaction datasets - comparing original sale prices against real auction and dealer resale values at one, three, and five years of age. These are population averages, not guarantees for any individual vehicle.
For context on why depreciation matters so heavily to total ownership expense, see how vehicle depreciation works. As a share of total cost, it routinely outweighs fuel and maintenance combined - a fact unpacked fully in the true cost of owning a car in the US.
| Average 5-year depreciation (new vehicle) | ~49-60% of MSRP (Industry average across mainstream segments) |
| Steepest depreciation window | Years 1-3 (Consistent across most vehicle categories) |
| Slowest-depreciating mainstream type | Full-size pickup trucks (~38-48% at 5 years) (Based on historical resale transaction data) |
| Fastest-depreciating mainstream types | Full-size sedans and minivans (~55-65% at 5 years) (Driven by shifting consumer demand) |
| EV first-year depreciation range | ~20-30% of MSRP (Higher than average; segment is evolving) |
| Typical year-1 loss (all types) | ~10-25% of MSRP (Varies widely by type and brand) |
Depreciation Rate Benchmarks by Vehicle Type
The figures below reflect general industry averages drawn from historical resale data. Actual rates vary by brand, trim level, mileage, condition, and regional market demand.
| Vehicle Type | Year 1 Loss | Year 3 Loss | Year 5 Loss |
|---|---|---|---|
| Compact / Midsize Sedan | ~15-20% | ~35-45% | ~50-60% |
| Full-Size Sedan | ~20-25% | ~40-50% | ~55-65% |
| Compact SUV / Crossover | ~15-20% | ~35-42% | ~45-55% |
| Full-Size SUV | ~18-22% | ~38-48% | ~50-60% |
| Midsize Pickup Truck | ~12-18% | ~28-38% | ~40-50% |
| Full-Size Pickup Truck | ~10-16% | ~25-35% | ~38-48% |
| Minivan | ~20-25% | ~42-50% | ~55-65% |
| Battery Electric Vehicle (BEV) | ~20-30% | ~45-55% | ~55-65% |
~49%
Average 5-year depreciation across mainstream vehicles
Industry resale data consistently shows new vehicles lose roughly half their value within five years of purchase.
~38-48%
5-year depreciation for full-size pickup trucks
Full-size trucks retain more value than any other mainstream category, reflecting persistent demand from commercial and consumer buyers.
~20-30%
First-year depreciation for battery electric vehicles
Rapid model updates and evolving battery technology have pushed EV first-year losses above the mainstream average, though the trend is shifting.
Pickup trucks consistently post the slowest depreciation of any mainstream category, driven by sustained commercial and consumer demand. Full-size sedans and minivans tend to depreciate fastest, reflecting shifting buyer preferences. Battery electric vehicles carry elevated first-year depreciation partly because rapid model-year updates and evolving battery technology put downward pressure on older units - though this picture continues to shift as the segment matures. For a detailed cost comparison between EVs and gasoline vehicles, see Gas vs. Electric: which costs less to own over five years.
Using These Figures in Your Ownership Decisions
Depreciation rates have direct implications for three common decisions: buying new versus used, selecting a vehicle type, and timing a purchase.
- New vs. used: Because the steepest depreciation occurs in years one through three, buyers who purchase a three-year-old vehicle can avoid absorbing the largest portion of value loss. New car vs. used car: which is the smarter financial choice walks through the full trade-off.
- Vehicle type selection: If low total cost of ownership is a priority, trucks and compact crossovers have historically held value better than full-size sedans or minivans. Factor depreciation alongside insurance and fuel before committing.
- Purchase timing: Model-year transitions and inventory cycles can affect initial transaction price, which in turn sets the base from which depreciation is calculated. Timing a car purchase: what affects price beyond the negotiation covers the key variables.
These Figures Are Averages, Not Predictions
Depreciation benchmarks represent historical averages across large samples of vehicles. Individual outcomes depend heavily on mileage, condition, color, trim level, regional demand, and broader economic conditions. Use these figures as a planning reference, not a precise forecast for any specific vehicle.
Regular upkeep also protects resale value by keeping the vehicle in documentable good condition. Car maintenance essentials provides practical guidance on keeping your vehicle in shape throughout the ownership period.
This article provides general reference figures for informational purposes only and does not constitute financial or purchasing advice. Depreciation rates vary significantly by vehicle, market conditions, and individual circumstances. Consult current market data and, where appropriate, a qualified financial adviser before making major vehicle decisions.